This methodology had some gap areas as it was revamped in 2003 and represented for commercial use. This was reintroduced even for the derivative segments too in the same year. Germans were the pioneer in this product segment as German exchange DTB introduced VOLAX or Volatility Index way back in 1998. Markets were quite premature at that time. Products with such innovation were not accepted with good spirit. So, it had to withdraw the same in the same year by the month of December. Eurex on the same path launched VDAX, VSMI and VSTOXX in the year 2005 but discontinued immediately. However, they launched again by 2009.
India VIX uses the lot size of 550. Minimum 10 Lakhs at the time of introduction is required. The operating range varies upto 10% of the base price or the daily settlement price. Very Tuesday of the week I kept as the expiry date. It could be effectively used in many places such as hedging equity or even derivative portfolios, in order to reduce or limit their risk. It could also will be used as a diversification tool in a specific investor’s portfolio. Direction of volatility could be understood, and certain time zones (with higher volatility could be avoided). India VIX has been found to be a moving average time series from the beginning.
If we want to understand the effect of India VIX in simple language then we have to take a small example. If India VIX is 11.0899273, this represents a probable volatility per annum of 11.0899273% in the Nifty over the next 30 days. So, the value of Nifty to be in a range between +11% and -11% from the present price of Nifty for the next 1 year for the next 30 days. So if Nifty is presently at 7000 the expected range of Nifty for 1 year is between 6230 and 7770. Where 6230 being the lower end and 7770 being the upper end.
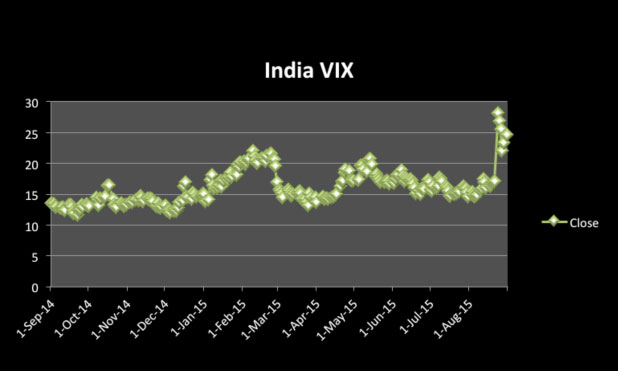
 If we observe the real figures in India VIX we will find some interesting movements. Last 1 year volatility has been in a close range of 15-20, however, since last one month it went to a sharp increase up to 30. Quite interestingly if the Nifty value (daily close or adjusted close) is considered for the same time horizon, the volatility measurement by GARCH indicates similar trends too.
That means that cash segment as well as derivative segment follows similar trends or patterns as volatility is concerned. India VIX has five key components, on the basis of which it has been constructed. They are time to expiry, interest rate, forward index level, bid-ask quotes and weightage.NSE Mibor rate fixes the interest rate, at the money determination helps to secure premium in a derivative contract and cubic splines for data expansion helps this Index to be built.
India VIX contracts are strictly marked to market (MTM) and open only for cash settlements. The regular and daily settlement price of India VIX futures would be the weighted average price for last 30 minutes of the respective futures contract in the Index.

A serial negative correlation has been observed between Nifty and India VIX specially post mid 2009.
India VIX has been found primarily as range bound, however on certain occasions such as August, September 2015, it has also seen to go north sharply thus increasing volatility to two folds (15 to 30). If the VIX is found over 25 and above it could be considered as high volatility coming soon.
This method of construction of volatility index is not quite unique though; however Nifty followed this probably as it is attached with a strong brand of CBOE. Indian markets are quite different when we compare them with US markets. The 10 Year G Sec rates hover around 2-3% in comparison to 8-9% in India. The movement of capital markets is mostly based on algorithmic trading in the US, so the logical and rational decisions are more likely. Indian investors hardly follow rational decision, irrespective of their strata. So, Indian bourses move along the lines of sentiments rather than logic.
Nifty could surely look out for a product of dynamic nature with sentiment component embedded in it to predict the volatility in the true sense in the Indian Capital Markets. Again India being an event driven economy, another trigger could well be the occurrence of an event such as budget or RBI policy decision.Time will show and prove the accuracy of prediction of this inaugural volatility index.
[1] nseindia.com
[2] cboe.com
[3]zerodha.com

